Monday, February 2, 2015

Friday, January 23, 2015
Bill Whittle exposes the TRUTH about gun-loving America vs the rest of the world
By The Right Scoop
This is a fantastic monologue by Bill Whittle that I’m sure you’re going to want to share. He hits back at the Left’s obsession with gun control by pointing out where gun-loving America really sits in the international arena when it comes to our murder rate.
Just watch:

About The Right Scoop
Blogger extraordinaire since 2009 and the owner and Chief Blogging Officer of the most wonderful and super fantastic blog in the known and unknown universe: The Right Scoop
Sunday, January 18, 2015
'Pin' Meet 'Housing Bubble 2.0' (Zerohedge.com)

Submitted by Tyler Durden on 01/17/2015 18:45 -0500
Housing bubble 2.0 just met Pin 2.0

The 30 Year U.S. Treasury bond yield hit 2.35% yesterday. That is the lowest rate in U.S. history for the 30 Year Treasury. During the deepest darkest depths of the recession in March 2009, after the stock market had fallen over 50%, the yield was 3.5%. One year ago it was yielding 4.0%. Long term interest rates are not controlled by Yellen. They reflect the economic prospects of the country. When they are rising it means the economy is doing well. When they are plummeting to all time lows, the economy is either in recession or headed into recession. Take your pick. No amount of government data manipulation, feel good propaganda spewed by the captured mainstream media, or Ivy League educated Wall Street economist doublespeak, can change the fact this economy is in the dumper and headed much lower. The Greater Depression is resuming its downward march toward inevitable war.

- KBH SEES 1Q BOTTOM LINE ABOUT BREAK-EVEN (against expectations of a 17c rise!)
- KB HOME CFO SAYS FIRST-QUARTER MARGINS EXPECTED TO BE DOWN
- KB HOME PULLED OUT OF `COUPLE’ HOUSTON LAND DEALS, CEO SAYS
- LENNAR CFO SAYS MARGINS ARE POISED TO NARROW ON LESS PRICING POWER
- LENNAR GROSS MARGIN DECLINED & SALES INCENTIVES GREW
- LENNAR CEO SAYS “ACROSS THE BOARD, WE’RE SEEING INTENSIFIED COMPETITION AS BUILDERS GO OUT AND CHASE VOLUME”
KB Home had revenues of $2.4 billion in 2014. They are one of the largest home builders in the country. It’s stock has dropped 30% in the last few days. It’s down 40% from its February 2014 high. It’s down 85% from its 2005 high. It had $9 billion of revenues and delivered 60,000 homes in 2005. Then Pin 1.0 popped the first bubble. Revenues collapsed to $1.3 billion and they lost hundreds of millions from 2007 through 2012.
Lennar had revenues of $7.0 billion in 2014. They are the largest home builder in the country. It’s stock has dropped 9% this week. It had been trading at a seven year high, but is still trading 33% below its 2005 bubble high. It had $14 billion of revenues and delivered 42,000 homes in 2005. Then Pin 1.0 popped their bubble. Revenues imploded to $3 billion and they also lost hundreds of millions from 2007 through 2012.
Their admissions earlier this week are proof Bubble 2.0 has met Pin 2.0. KB Home’s 85% increase in revenue and Lennar’s 130% increase in revenue since 2011 have been nothing but a Federal Reserve/Wall Street/U.S. Treasury engineered scheme to repair the balance sheets of the insolvent Too Big To Trust Wall Street banks. The financial industry oligarchs and their servile lackey puppet politicians decided an easy money, Wall Street created scheme to boost home prices would benefit the .1% and restore some of their fraudulently acquired wealth. It isn’t a coincidence home prices rose in parallel with the Fed’s QE programs. And it isn’t a coincidence the bubble is rapidly deflating now that QE3 is over.
The fraudulent nature of the supposed housing recovery can be deciphered by analyzing a few pertinent data points. 30 year mortgage rates were in the 5% to 6% range during the first bubble. Mortgage rates have been consistently below 4% for the last three years. In a healthy market driven economy, these low rates should have brought in first time home buyers and led to a sustainable long-term recovery.

Instead, the number of homes bought by first time buyers has languished at record low levels. The majority of homes sold in 2011 and 2012 were distressed foreclosures and short sales, and the vast majority of sales in the last two years have been to Federal Reserve financed Wall Street investors, Chinese billionaires and fast buck flippers. New home sales of just above 400,000 five years into an economic recovery are at previous recession lows, despite record low mortgage rates. They languish 65% below 2005 levels, when KB Home and Lennar were minting money. Existing home sales of 5 million are back at 1999 levels and 30% below the 2005 highs. This pitiful result is after $3.5 trillion of QE, extremely low mortgage rates, and tremendous hype from the NAR and the corporate MSM (It’s always the best time to buy).
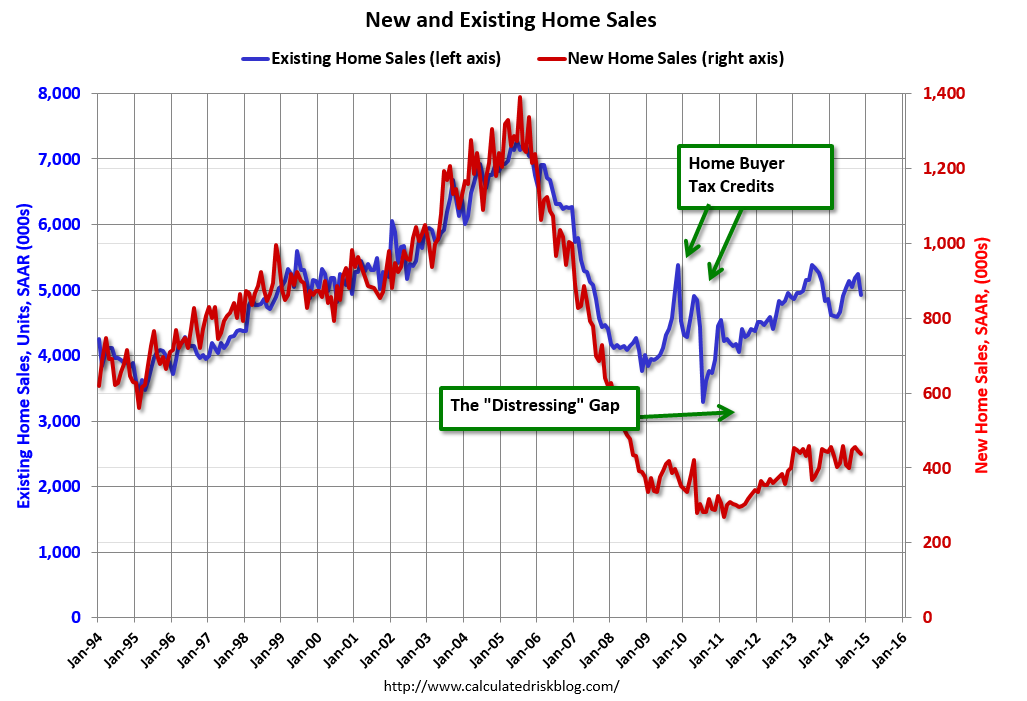
The falsity of the housing recovery storyline can be seen in the fact that mortgage applications linger at 1995 levels, even though mortgage rates are 400 basis points lower than they were in 1995. A critical thinking individual might ask how home prices could rise by 20% since 2012 even though mortgage purchase applications are 20% lower than they were in 2012 and 65% below 2005 levels. The answer is they couldn’t have risen by 20% without massive monetary manipulation and insider deals between Wall Street banks, Wall Street hedge funds, FNMA, Freddie Mac, The Fed, and the U.S. Treasury.

You see, average Americans buy houses not as an investment, but as a place to live. They save enough for a down payment by spending less than they earn, and then make monthly payments for 30 years from their rising household income. Of course, that was the old days. Real median household income is exactly where it was in 1995. It is currently below the level of 1989. Average Americans have made no headway in 20 years. The median price of a home in 1995, according to the Census Bureau, was $128,000. The median price of a home today is $281,000. When prices go up 120% and your real income remains stagnant, even record low mortgage rates is just pushing on a string. With real wages continuing to fall, young people saddled with a trillion dollars of student loan debt, the full impact of the Obamacare neutron bomb (kills small business, doctors and jobs, but not insurance conglomerates or government bureaucracy) just detonating, and an economy clearly going into the tank, there is absolutely no possibility of a real housing recovery in the foreseeable future.

The Too Big To Trust banks have consistently accounted for 35% to 55% of all mortgage originations in the U.S. over the last four years. Wells Fargo is the undisputed leader. All of these banks have reported dreadful financial results this week, with plunging revenues and profits, even with accounting shenanigans like relieving loan loss reserves and marking their balance sheets to fantasy rather than true market values. In the midst of a supposed housing recovery, with mortgage rates at historic lows, the largest mortgage originator in the world, saw their mortgage originations FALL by 12% over last year. They are down 65% from two years ago. JP Morgan and Citigroup also saw their mortgage businesses contracting. These banks have been firing thousands of people in their mortgage divisions. This is surely a sign of a healthy growing housing market. Right?

Essentially, the entire housing recovery storyline has revolved around the Federal Reserve providing free money to Wall Street banks, who then withheld foreclosures from the market, sold them in bulk at inflated prices to Wall Street hedge funds like Blackstone, who then created a nationwide rental business, driving prices higher. FNMA and Freddie Mac did their part by selling their bulk foreclosures to the same connected hedge funds. The average person had no opportunity to bid on foreclosed homes and reap the benefits of lower prices. Blackstone has since created a new derivative, by packaging their rental income streams into an “investment” to sell to muppets. Their rental properties are concentrated in the previous bubble markets of Arizona, California, Florida, and Nevada. What a beautiful business concept. Free money from their Federal Reserve sugar daddy, kicking people out of their homes and then renting their houses back to them, driving prices higher by restricting supply and stopping new household formations, double dipping by creating a new exotic subprime investment opportunity, and then exiting stage left before it all blows sky high again.

The areas of the country with the highest percentage of Wall Street owned rental properties have had the largest price increases over the last three years. Some people never learn. Blackstone and the rest of the Wall Street crowd stopped buying properties in 2014. They’ve achieved their objective – easy profits. They have no intention of being long-term landlords. They are seeking the greater fools to take these properties off their hands at inflated prices. The result will be rapidly falling prices, as there is no real demand for these properties.

The only thing propping up the housing market has been QE, connected Wall Street insiders, Chinese billionaires trying to get their money out of China before their collapse, and the usual flip that house morons you’ve seen on cable TV. QE has ceased. The Wall Street shysters are selling. The Chinese billionaires are only impacting the high end. The low IQ flippers are stuck holding the bag again. It’s no coincidence the Case-Shiller Index has been in a steady DECLINE since the beginning of 2014. Prices have round tripped back to 2012 levels and are headed back to 2009 levels. What a shame. Maybe they can hand out t-shirts that say:
THE FED PRINTED $3.5 TRILLION AND ALL I GOT WAS THIS STUPID T-SHIRT

Two of the biggest home builders in the country have already warned that 2015 is going to be bad. And they are surely painting a rosier picture than they will ever admit. Corporate executives aren’t known for honesty or forthrightness. A perfect storm is brewing and the second Fed induced housing bubble of this century is deflating rapidly. The plunge in oil prices is not due to over-supply. It’s due to under-demand. A global deflationary contraction is underway. What higher paying employment growth and capital investment that has occurred since 2009 was spurred by high oil prices. Texas has led the charge. Energy related companies are announcing thousands of layoffs, and the fun has just begun. Lance Roberts explains the ripple effects:
The majority of the jobs “created” since the financial crisis have been lower wage paying jobs in retail, healthcare and other service sectors of the economy. Conversely, the jobs created within the energy space are some of the highest wage paying opportunities available in engineering, technology, accounting, legal, etc. In fact, each job created in energy related areas has had a “ripple effect” of creating 2.8 jobs elsewhere in the economy from piping to coatings, trucking and transportation, restaurants and retail.
Energy companies have accounted for 25% of all S&P 500 capital expenditures. They are slashing cap-ex budgets by billions. Revenues and profits of energy companies are collapsing. Unemployment claims have already begun to rise. Retail sales growth below 3% always portends or confirms recession. People without jobs, burdened with student loan debt, and living on the same income they had in 1989, do not buy houses. Without QE and Wall Street hedge funds to prop up the market, the bubble is popped. Maybe someone should ask Ben Bernanke at one of his $300,000 lunch time speeches for Bank of America what he thinks about the housing market. He does have an Ivy league education and did save the world.
“We’ve never had a decline in house prices on a nationwide basis. So, what I think what is more likely is that house prices will slow, maybe stabilize, might slow consumption spending a bit. I don’t think it’s gonna drive the economy too far from its full employment path, though.” – Ben Bernanke – July 2005
Merchants of Smear
Obama, Gore other climate alarmists refuse to debate, but love to vilify - and love their money
Paul Driessen
Manmade climate disaster proponents know the Saul Alinksy community agitator playbook by heart. In a fight, almost anything goes. Never admit error; just change your terminology and attack again. Expand your base, by giving potential allies financial and political reasons to join your cause. Pick “enemy” targets, freeze them, personalize them, polarize them and vilify them.
The “crisis” was global cooling, until Earth stopped cooling around 1976. It was global warming, until our planet stopped warming around 1995. The alarmist mantra then became “climate change” or “climate disruption” or “extreme weather.” Always manmade. Since Earth’s climate often fluctuates, and there are always weather extremes, such claims can never be disproven, certainly not to the alarmists’ satisfaction.
Alarmists say modern civilization’s “greenhouse gas” emissions are causing profound climate change - by replacing the powerful, interconnected solar and other natural forces that have driven climate and weather patterns and events since Earth and human history began. They insist that these alleged human-induced changes are already happening and are already disastrous. Pope Francis says we are already witnessing a “great cataclysm” for our planet, people and environment.
However, there is no cataclysm, now or imminent, even as atmospheric carbon dioxide levels have gone well past the alleged 350 parts-per-million “tipping point,” and now hover near 400 ppm (0.04%). There has been no warming since 1995, and recent winters have been among the coldest in centuries in the United Kingdom and continental Europe, despite steadily rising levels of plant-fertilizing CO2.
As of January 12, 2015, it has been 3,365 days (9.2 years!) since a Category 3-5 hurricane hit the US mainland. This is by far the longest such stretch since record-keeping began in 1900, if not since the American Civil War. Sea levels are barely rising, at a mere seven inches per century. Antarctic sea ice is expanding to new records; Arctic ice has also rebounded. Polar bears are thriving. In fact:
Every measure of actual evidence contradicts alarmist claims and computer model predictions. No matter how fast or sophisticated those models are, feeding them false or unproven assumptions about CO2 and manipulated or “homogenized” temperature data still yields garbage output, scenarios and predictions.
That’s why alarmists also intoned the “peak oil” and “resource depletion” mantra - until fracking produced gushers of new supplies. So now they talk about “sustainable development,” which really means “whatever we advocate is sustainable; whatever we despise and oppose is unsustainable.”
USEPA Administrator Gina McCarthy also ignores climate realities. Her agency is battling coal-fired power plants (and will go after methane and gas-fired generators next), to “stop climate change” and “trigger a range of investments” in innovation and a “clean power future.” What she really means is: Smart businesses will support our agenda. If they do, we’ll give them billions in taxpayer and consumer money. If they oppose us, we will crush them. And when we say innovation, we don’t mean fracking.
As to responding to these inconvenient climate realities, or debating them with the thousands of scientists who reject the “dangerous manmade climate change” tautology, she responds: “The time for arguing about climate change has passed. The vast majority of scientists agree that our climate is changing.”
This absurd, dismissive assertion underscores citizen investigative journalist Russell Cook’s findings, in his perceptive and fascinating Merchants of Smear report. The climate catastrophe narrative survives only because there has been virtually no debate over its scientific claims, he explains. The public rarely sees the extensive evidence debunking and destroying climate cataclysm assertions, because alarmists insist that “the science is settled,” refuse to acknowledge or debate anyone who says otherwise, and claim skeptical scientists get paid by oil companies, tainting anything they say.
The fossil-fuel-payoff claim is classic Alinsky: Target and vilify your “enemies.”
“No one has ever offered an iota of evidence” that oil interests paid skeptical researchers to change their science to fit industry views, :despite legions of people repeating the claim,” Cook notes. “Never has so much, the very survival of the global warming issue depended on so little a paper-thin accusation from people having hugely troubling credibility issues of their own.” The tactic is intended to marginalize manmade global warming skeptics. But the larger problem is mainstream media malfeasance: reporters never question “climate crisis” dogmas...or allegations that “climate denier” scientists are willing to fabricate studies questioning “settled science” for a few grand in illicit industry money.
Pay no attention to the real-world climate or those guys behind the curtain, we are told. Just worry about climate monsters conjured up by their computer models. “Climate change deniers” are Big Oil lackeys and you should turn a blind eye to the billions of dollars in government, industry and foundation money paid annually to researchers and modelers who subscribe to manmade climate disruption claims.
In fact, the US government alone spent over $106 billion in taxpayer funds on alarmist climate research between 2003 and 2010. In return, the researchers refuse to let other scientists, IPCC reviewers or FOIA investigators see their raw data, computer codes or CO2-driven algorithms. The modelers and scientists claim the information is private property, even though taxpayers paid for the work and the results are used to justify energy, job and economy-killing policies and regulations. Uncle Sam spends billions more every year on renewable energy programs that raise energy prices, cost jobs and reduce living standards.
None of these recipients wants to derail this money train, by entertaining doubts about the “climate crisis.” Al Gore won’t debate anyone or even address audience questions he hasn’t preapproved.
As to claims of a “97% consensus,” one source is responses from 75 of 77 “climate scientists” who were selected from a 2010 survey that went to 10,257 scientists. Apparently, the analysts didn’t like the “consensus” of the other 10,180 scientists. Another study, by a University of Queensland professor, claimed that 97% of published scientific papers agree that humans caused at least half of the 1.3 F (0.7 C) global warming since 1950; in reality, only 41 of the 11,944 papers cited explicitly said this.
“Skeptical” scientists do not say climate doesn’t change or humans don’t affect Earth’s climate to some (small) degree. However, more than 1,000 climate scientists, 31,000 American scientists and 48% of US meteorologists say there is no evidence that we are causing dangerous warming or climate change.
Two recent United States Senate staff reports shed further light on other shady dealings that underlie the “dangerous manmade climate change” house of cards. Chains of Environmental Command reveals how Big Green activists and foundations collude with federal agencies to develop renewable energy and anti-hydrocarbon policies. EPA’s Playbook Unveiled shines a bright light on the fraud, deceit and secret science behind the agency’s sue-and-settle lawsuits, pollution standards and CO2 regulations.
The phony “solutions” to the imaginary “climate crisis” hurt our children and grandchildren, by driving up energy prices, threatening electricity reliability, thwarting job creation, adversely impacting people’s health and welfare, and subsidizing wind turbines that slaughter birds and bats. They perpetuate poverty, misery, disease and premature death in poor African and Asian countries, by blocking construction of fossil fuel power plants that would bring electricity to 1.3 billion people who still do not have it.
The caterwauling over climate change has nothing to do with real-world warming, cooling, storms or droughts. It has everything to do with an ideologically driven hatred of hydrocarbons, capitalism and economic development, and a callous disdain for middle class workers and impoverished Third World families that “progressive” activists, politicians and bureaucrats always claim to care so much about.
House and Senate committees should use studies cited above as a guide for requiring a robust pollution, health and climate debate. They should compel EPA, climate modelers and scientists to testify under oath, present their evidence and respond to tough questions. Congress should then block any regulations that do not conform to the scientific method and basic standards of honesty, transparency and solid proof.
Paul Driessen is senior policy analyst for the Committee For A Constructive Tomorrow (http://www.CFACT.org), author of Eco-Imperialism: Green power - Black death and coauthor of Cracking Big Green: To save the world from the Save-the-Earth money machine.
Jan 15, 2015
Sunday, January 11, 2015
Oceans not acidifying – “scientists” hid 80 years of pH data
joannenova.com.au ^ | January 5th, 2015 | Joanne
Posted on 1/10/2015 3:20:59 PM by Ernest_at_the_Beach
Co-authored James Doogue and JoNova
Empirical data withheld by key scientists shows that since 1910 ocean pH levels have not decreased in our oceans as carbon dioxide levels increased. Overall the trend is messy but more up than down, becoming less acidic. So much for those terrifying oceans of acid that were coming our way.
What happened to those graphs?
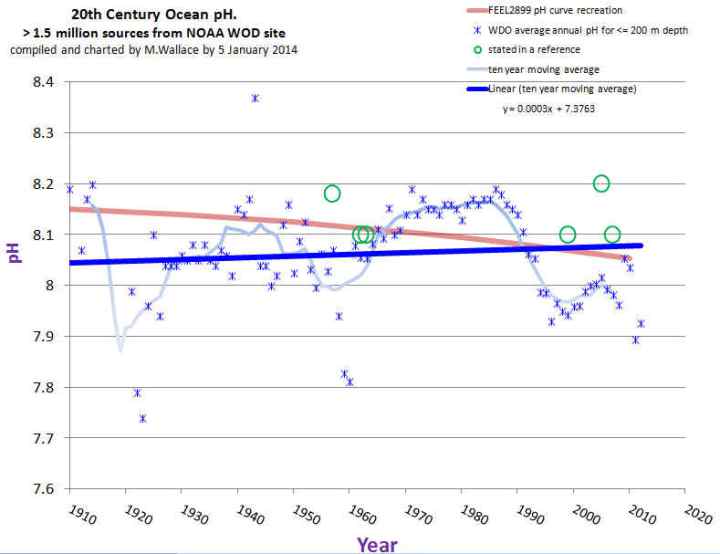
Scientists have had pH meters and measurements of the oceans for one hundred years. But experts decided that computer simulations in 2014 were better at measuring the pH in 1910 than the pH meters were. The red line (below) is the models recreation of ocean pH. The blue stars are the data points — the empirical evidence.
James Delingpole on ‘Breitbart’:
NOAAgate: ‘ocean acidification’ could turn out to be the biggest con since Michael Mann’s Hockey Stick
- …
The alleged fraud was uncovered by Mike Wallace, a hydrologist with nearly 30 years’ experience now working towards his PhD at the University of New Mexico. While studying a chart produced by Feely and Sabine, apparently showing a strong correlation between rising atmospheric CO2 levels and falling oceanic pH levels, Wallace noticed that some key information had been omitted.
Mysteriously, the chart only began in 1988. But Wallace knew for a fact that there were oceanic pH measurements dating back to at least 100 years earlier and was puzzled that this solid data had been ignored, in favour of computer modelled projections.
It has all the usual marks of modern bureaucratized science: scientists use a short stretch of data and computers to guesstimate a long “dataset”. Then when asked, they get huffy, hide the data, and insult the questioner. The poor sod seeking access to publicly funded data has to do an FOIA request, which in this case wasn’t successful, but then he got the data another way anyhow. Money was wasted hiding the data, it was wasted on bad policies, it was wasted defending an FOIA request, and dare I suggest, it was wasted training and paying the salaries of people who call themselves scientists but don’t act like them.
Feely’s chart, first mentioned, begins in 1988—which is surprising, as instrumental ocean pH data have been measured for more than 100 years — since the invention of the glass electrode pH (GEPH) meter. As a hydrologist, Wallace was aware of GEPH’s history and found it odd that the Feely/Sabine work omitted it. He went to the source. The NOAA paper with the chart beginning in 1850 lists Dave Bard, with Pew Charitable Trust, as the contact.
Wallace sent Bard an e-mail: “I’m looking in fact for the source references for the red curve in their plot which was labeled ‘Historical & Projected pH & Dissolved Co2.’ This plot is at the top of the second page. It covers the period of my interest.” Bard responded and suggested that Wallace communicate with Feely and Sabine—which he did over a period of several months. Wallace asked again for the “time series data (NOT MODELING) of ocean pH for 20th Century.”
Sabine responded by saying that it was inappropriate for Wallace to question their “motives or quality of our science,” adding that if he continued in this manner, “you will not last long in your career.” He then included a few links to websites that Wallace, after spending hours reviewing them, called “blind alleys.” Sabine concludes the e-mail with: “I hope you will refrain from contacting me again.” But communications did continue for several more exchanges.
In an effort to obtain access to the records Feely/Sabine didn’t want to provide, Wallace filed a Freedom of Information Act (FOIA) request.
We were told that coral reefs would crumble, crabs and molluscs would be unable to build their protective shells, the ocean food chain would collapse, and therefore the global food chain would fall apart.
Clearly the ten year moving average of ocean pH since 1910 has a slight upward curve. This means that in fact the alkalinity of the ocean has increased, not decreased. It has become LESS ACIDIC. The researchers Feely and Sabine would have known this. But it suited their purpose to truncate the data to start in 1988 to allow them to show a falling pH level over that relatively short period instead of the actual long-term increasing trend.
Wallace says: “Oceanic acidification may seem like a minor issue to some but, besides being wrong, it is a crucial leg to the entire narrative of ‘human-influenced climate change’.”
He adds: “In whose professional world is it acceptable to omit the majority of the data and also not disclose the omission to any other soul or Congressional body?”
What we have here is one of the basic foundations of the climate change scare, that is falling ocean pH levels with increased atmospheric CO2 content, being completely dismissed by the empirical ocean pH data the alarmist climate scientists didn’t want to show anyone because it contradicted their ‘increasing ocean acidity’ narrative.
Further information
- Marita Noon runs a blog called Energy Freedom. Her post on this.
- There is a petition set up by Wallace to restore the worlds ocean pH measurements
- The man who uncovered this is Mike Wallace.
- Read here for the full final draft of the most recent UN IPCC Report.
- Read here for the extracts confirming the above points.
h/t to Joffa, Climate Depot, Heartland
Monday, January 5, 2015
The 'Equality' Racket (Creators.com)

Thomas Sowell
Some time ago, burglars in England scrawled a message on the wall of a home they had looted: "RICH BASTARDS."
Those two words captured the spirit of the politicized vision of equality — that it was a grievance when someone was better off than themselves.
That, of course, is not the only meaning of equality, but it is the predominant political meaning in practice, where economic "disparities" and "gaps" are automatically treated as "inequities." If one racial or ethnic group has a lower income than another, that is automatically called "discrimination" by many people in politics, the media and academia.
It doesn't matter how much evidence there is that some groups work harder in school, perform better and spend more postgraduate years studying to acquire valuable skills in medicine, science or engineering. If the economic end results are unequal, that is treated as a grievance against those with better outcomes, and a sign of an "unfair" society.
The rhetoric of clever people often confuses the undeniable fact that life is unfair with the claim that a given institution or society is unfair.
Children born into families that raise them with love and with care to see that they acquire knowledge, values and discipline that will make them valuable members of society have far more chances of economic and other success in adulthood than children raised in families that lack these qualities.
Studies show that children whose parents have professional careers speak nearly twice as many words per hour to them as children with working class parents — and several times as many words per hour as children in families on welfare. There is no way that children from these different backgrounds are going to have equal chances of economic or other success in adulthood.
The fatal fallacy, however, is in collecting statistics on employees at a particular business or other institution, and treating differences in the hiring, pay or promotion of people from different groups as showing that their employer has been discriminating.
Too many gullible people buy the implicit assumption that the unfairness originated where the statistics were collected, which would be an incredible coincidence if it were true.
Worse yet, some people buy the idea that politicians can correct the unfairness of life by cracking down on employers. But, by the time children raised in very different ways reach an employer, the damage has already been done.
What is a problem for children raised in families and communities that do not prepare them for productive lives can be a bonanza for politicians, lawyers and assorted social messiahs who are ready to lead fierce crusades, if the price is right.
Many in the media and among the intelligentsia are all too ready to go along, in the name of seeking equality. But equality of what?
Equality before the law is a fundamental value in a decent society. But equality of treatment in no way guarantees equality of outcomes.
On the contrary, equality of treatment makes equality of outcomes unlikely, since virtually nobody is equal to somebody else in the whole range of skills and capabilities required in real life. When it comes to performance, the same man may not even be equal to himself on different days, much less at different periods of his life.
What may be a spontaneous confusion among the public at large about the very different meanings of the word "equality" can be a carefully cultivated confusion by politicians, lawyers and others skilled in rhetoric, who can exploit that confusion for their own benefit.
Regardless of the actual causes of different capabilities and rewards in different individuals and groups, political crusades require a villain to attack — a villain far removed from the voter or the voter's family or community. Lawyers must likewise have a villain to sue. The media and the intelligentsia are also attracted to crusades against the forces of evil.
But whether as a crusade or a racket, a confused conception of equality is a formula for never-ending strife that can tear a whole society apart — and has already done so in many countries.
Thomas Sowell is a senior fellow at the Hoover Institution, Stanford University, Stanford, CA 94305. His website is www.tsowell.com. To find out more about Thomas Sowell and read features by other Creators Syndicate columnists and cartoonists, visit the Creators Syndicate Web page at www.creators.com.
COPYRIGHT 2015 CREATORS.COM
Saturday, December 20, 2014
The Housing Bubble Explained in One Little Gem of an Excerpt...The Housing Bubble Explained in One Little Gem of an Excerpt...
Published on Zero Hedge (http://www.zerohedge.com)
Home > The Housing Bubble Explained in One Little Gem of an Excerpt...
By Tyler Durden
Created 12/19/2014 - 18:55
Submitted by Thad Beversdorf via First Rebuttal blog [9],
For some reason I feel like this is a good time to review what we can expect when our government and its agencies attempt to create wealth out of thin air. We can see the absurdity and hubris of our policymakers who believe they can circumvent economic laws in the following excerpt from the “The National Homeownership Strategy: Partners in the American Dream” [10]. This is a document that was put together by HUD and some other private and public stakeholders at the request of President Clinton way back in 1995. Isn’t it amazing how poor policies that seem so right at the time, to some, end up kicking us in the ass for decades. And as much as the government has gotten comfortable with the storyline suggesting banks are responsible for the entire mortgage bubble mess of the mid 2000′s, it was, in fact, all started by government agenda. Have a look at this little gem which I am suggesting is the document that led us to the economic devastation from which we are yet to crawl out.
For many potential homebuyers, the lack of cash available to accumulate the required downpayment and closing costs is the major impediment to purchasing a home. Other households do not have sufficient available income to to make the monthly payments on mortgages financed at market interest rates for standard loan terms. Financing strategies, fueled by the creativity and resources of the private and public sectors, should address both of these financial barriers to homeownership.
And while we all love a bit of creativity in life, maybe best to avoid creativity in an effort to ignore risk fundamentals. Yet our government was certain it could defy gravity. A child could tell you that if a person doesn’t have sufficient money to pay back a loan, well they shouldn’t have a loan in the firsplace. And so to force banks to lend depositors’ money to borrowers who have neither the required down payment nor the cash-flow to cover monthly payments is simply absolute unadulterated stupidity. Most of us, if we had been made aware of that thought process, would have put a stop to it straight away.
So what lesson did we learn the hard way? Looking around today, absolutely nothing. Our government officials and policymakers continue to operate under the presumption they are gods, not subject to the laws of this world. Despite creating such immense devastation last time around they have actually convinced themselves that they are not responsible (evidenced by the $350 billion they have pillaged from the banks in the name of justice for having created the housing bubble). And so by not acknowledging their mistake it allows them to still believe they can make pigs fly. Specifically, the central bank is printing incredible stocks of money and pushing it directly into the stock market in an effort to create economic growth from nothing. Their storyline is that such a strategy will create so much wealth at the top that it will spill over onto the rest of society. They also believe there will be no consequence to printing an unprecedented supply of dollars despite the laws of economics very clearly telling us there most certainly will be consequences.
Now while they have managed to delay the inevitable devastation, it is coming. You see everything is a trade off. You can create long drawn out overpriced markets but ultimately fundamentals will trump all and the subsequent recalibration will be that much more painful. The fundamentals always come back into the equation. Like anything, if you want to reduce the iterations you can but each iteration will then be larger. Let me show you what I mean by reviewing historical market trends.
The following charts depict monthly returns (green line) and S&P price level (blue line) with a 24 month moving average (black line). Note each chart depicts a different time period. The first chart is 1950 to 1981, the second is 1981 to 1993 and the last chart is 1993 to present. I’ve separated them in this way because there are 3 very distinct characteristics that are present between the three periods. Look closely at the 24 month moving average and compare them across the three periods.


What we discover from the first chart is that between 1950 and 1980 we see very even cyclicality in the 2 year moving average of quite moderate positive peaks and negative troughs repeating every 2 or 3 years. However, subsequent to 1981 we see something quite different. Our 2 year moving average no longer has negative troughs. In fact, the 2 year moving average stays positive and very calm from the end of ’81 through to mid ’93. The third chart takes us into the extreme bubbles phase. Here we see a strong positive trend with more variation than in the previous phase but with intermittent significant drawdowns. This is different from the first phase where drawdowns were very regular but minimal in size and not catastrophic. Whereas in this latest phase we have much longer periods in between drawdowns but each drawdown is many times more severe than in the first phase.
So this all begs the question why? What caused the normal market cyclical iterations to change so significantly seemingly out of nowhere? Well think about Fed policy between the three phases. In the early phase our monetary policy was constrained by Bretton/Woods. The second phase coincides with Volker taking over as Fed Chair and implementing very tight monetary policy with a focus shift to inflation control and so limiting money supply expansion. The final phase corresponds with a very sharp increase in M2 expansion that continues today.
And so these variations in market trends seem to correlate to the underlying monetary policies. Certainly there are significant changes within the sophistication of the market itself however, human behaviour is the same over time and markets react to market forces the same way over time. And so what is different then are the underlying market forces. And we see three very distinct market trends indicating there are three very different underlying market forces between the three periods. Understanding these differences should make it easy to identify and acknowledge how monetary policy is affecting markets.
There is perhaps no natural best trend but the people should decide which market behaviour suits what we want out of a market and then apply the appropriate policies accordingly. If large bubble build ups followed by infrequent but devastating crashes is the objective well then it appears our policymakers are right on point. But let’s try to understand exactly what is taking place.

You can see the acceleration of M2 expansion in the mid 1990′s that has yet to slow down. But money supply is not the only major underlying economic shift. Thing is if we are allocating that money supply efficiently then economic growth would be extraordinary and that would support the notion of all time high markets. So let’s see how efficiently we are deploying our money.

We can see back in the ’60′s and ’70′s efficiency of money allocation was fairly steady around 1.75. Then into the Volker years money velocity improved slightly in the first half of the decade and then really took off toward the end of the ’80′s and into the first half of the ’90′s. However, monetary efficiency seems to have peaked around the time M2 money stock started into it’s hyper-acceleration phase in the mid 1990′s. Since then monetary efficiency has been a falling knife, yet to hit the ground. And if we look at the next chart it really ties this altogether for us.

Right up until the early to mid 1990′s we were allocating money to economic boosting investments. Things like fixed capital reinvestment. However, toward the mid ’90′s we began to reallocate money toward financial markets and away from economic investments. This trend too continues today. The end result is that our economic policymakers and really the consciousness of society is so narrowly focused on “The Market” that we seem uninterested in all things not securitized. And what this suggests is that once again our policymakers believe they can ignore economic laws. That they can somehow create economic growth from nothing.
Last time it was handing out houses to folks who had not earned those assets in hopes that would somehow become real. This time its printing endless amounts of dollars, sticking them in the stock market money machine and expecting that to somehow create economic prosperity to all. It is mind boggling that men with so much power can be so incredibly thick. The hubris is par for the course with such power, but one would not expect such stupidity. The real ugliness of it all is that while those on top will ultimately create more wealth from the coming devastation, the vast majority of Americans have been forced to play along. Forced to put their savings in the money machine that is now the only game in town.
And so when it does inevitably all come tumbling down only 6 years after the last policies failure, it will mean the end for so many. And because those stories would reflect poorly on the prominent men whose stupidity led to such destruction those stories will not be told with truth. They will be told as though retirees were taking outrageous risks late in life when everybody knows you should not be in the market. Just as it was the banks, the borrowers and the brokers who were solely responsible for the housing bubble that devastated so many, including the folks you never hear about who lost 30% equity in their homes but continued to quietly and responsibly pay their mortgages. Yes once again those responsible will profit from their misguided policies and will bear no accountability for the horrible consequences of their decisions. Ah yes, America…. ain’t she wonderful!

Gun Violence In America (In 6 Uncomfortable Charts) (Zerohedge)
Submitted by Tyler Durden on 12/19/2014 22:25 -0500
A recent report, The Annual Review of Public Health, summarizes the basic facts of firearm violence, a large and costly public health problem in the United States for which the mortality rate has remained unchanged for more than a decade. It presents findings for the present in light of recent trends. Risk for firearm violence varies substantially across demographic subsets of the population and between states in patterns that are quite different for suicide and homicide. Suicide is far more common than homicide and its rate is increasing; the homicide rate is decreasing. As with other important health problems, most cases of fatal firearm violence arise from large but low-risk subsets of the population; risk and burden of illness are not distributed symmetrically. Compared with other industrialized nations, the United States has uniquely high mortality rates from firearm violence.
SUMMARY POINTS
1. The overall fatality rate from firearm violence has not changed in more than a decade.

2. Suicide is the most common form of fatal firearm violence (64.0% of deaths in 2012) and is increasing. Homicide is decreasing.

3. Homicide risk is concentrated to a remarkable degree among Black males through much of the life span. Mortality rates from firearm violence are very high and unchanged in this group.

4. Suicide risk is highest among White males beginning in adolescence. They also account for most fatalities from firearm violence and have increasing mortality rates.

5. As compared with other industrialized nations, the United States has low rates of assaultive violence...

...but uniquely high mortality rates from firearm homicide and suicide.

Sunday, December 7, 2014

Saturday, December 6, 2014
19 Signs That You Live In A Country That Has Gone Completely Insane (ZeroHedge)
Submitted by Michael Snyder of The End of The American Dream blog
Do you ever feel like you are living in a “Bizarro World”? That is how I feel much of the time. I look around and it seems as though some form of mass psychosis has descended on most of the population. Things that would have had Americans angrily marching in the streets a generation or two ago are now just accepted as “normal” by the “sheeple” that populate this nation. If the talking heads that endlessly spew nonsense at us through our televisions tell us to believe something, no matter how absurd it is, most people just go along with it. Before we had televisions and radios and computers and movies and the Internet, people actually had to do the hard work of thinking for themselves. But now we are all plugged into this giant “matrix” that tells us what to think, what to believe and how to feel about things. And unfortunately, the people that are telling us what to think and believe are delusional themselves. The blind are leading the blind, and as a result our nation is coming apart at the seams all around us.
The following are 19 signs that you live in a country that has gone completely insane…
#1 When those occupying the highest offices in the land tell you that an $18,000,000,000,000 debt is “under control“, you live in a country that has gone completely insane.
#2 When your president starts acting like an emperor and begins ruling by decree and your elected representatives won’t lift a finger to do anything to stop it, you live in a country that has gone completely insane.
#3 When the greatest dream in life for millions of your fellow citizens is to win the Powerball jackpot, you live in a country that has gone completely insane.
#4 When dressing up sex dolls in fashionable clothing and photographing them is considered to be art, you live in a country that has gone completely insane.
#5 When only 36 percent of the population can name all three branches of government, you live in a country that has gone completely insane.
#6 When a boy can sue his high school for not letting him use the girls’ restrooms and win $75,000 in “damages”, you live in a country that has gone completely insane.
#7 When people that want to have sex with their own family members start demanding “equal rights”, you live in a country that has gone completely insane…

#8 When pregnancy is considered to be a “disease” and babies are considered to be “liabilities”, you live in a country that has gone completely insane.
#9 When the federal government collects billions of our phone calls and emails and hardly anyone gets upset about it, you live in a country that has gone completely insane.
#10 When 30 million of your fellow citizens are taking antidepressants, you live in a country that has gone completely insane.
#11 When an endless stream of gang members, drug dealers, sexual predators, welfare parasites and Middle Eastern terrorists can enter the country illegally and nothing is done, but anyone who criticizes this is in danger of being put on an “enemies list“, you live in a country that has gone completely insane.
#12 When you can get arrested for “encouraging terrorism on Twitter“, but not for publicly burning the American flag in the middle of the street, you live in a country that has gone completely insane.
#13 When your military airdrops huge loads of weapons into the hands of the very terrorists that they are supposed to be fighting, you live in a country that has gone completely insane.
#14 When there are 2.5 million homeless children living in your nation and nobody is calling it a “national emergency”, you live in a country that has gone completely insane.
#15 When a fifth-grade student can get suspended from school for making an imaginary gun with his fingers, you live in a country that has gone completely insane.
#16 When Congress has to pass a law to keep federal workers from watching porn all day long, you live in a country that has gone completely insane.
#17 When the number of payday lenders is greater than the number of Starbucks locations, you live in a country that has gone completely insane.
#18 When an illegal immigrant can get a drivers’ license, but the head of a fire department of a major U.S. city is suspended from his job without pay for promoting sexual morality, you live in a country that has gone completely insane.
#19 When the general public knows far more about Kim Kardashian than it does about the Federal Reserve, you live in a country that has gone completely insane.
Average:

