joannenova.com.au ^ | January 5th, 2015 | Joanne
Posted on 1/10/2015 3:20:59 PM by Ernest_at_the_Beach
Co-authored James Doogue and JoNova
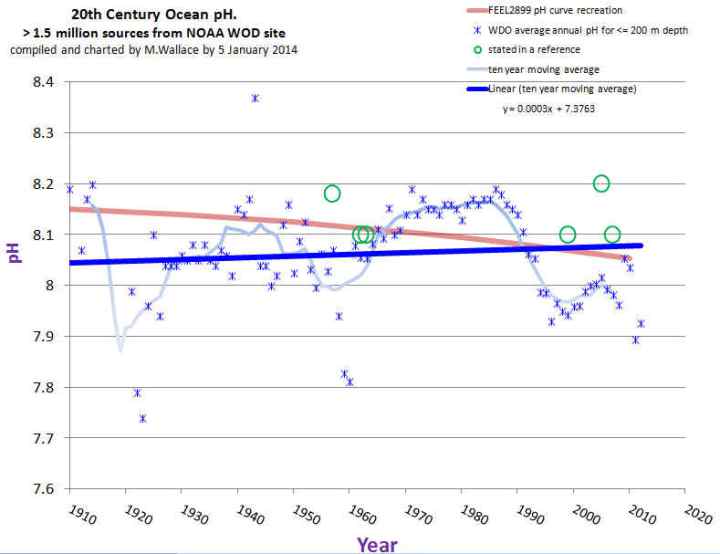
Empirical data withheld by key scientists shows that since 1910 ocean pH levels have not decreased in our oceans as carbon dioxide levels increased. Overall the trend is messy but more up than down, becoming less acidic. So much for those terrifying oceans of acid that were coming our way.
What happened to those graphs?
Scientists have had pH meters and measurements of the oceans for one hundred years. But experts decided that computer simulations in 2014 were better at measuring the pH in 1910 than the pH meters were. The red line (below) is the models recreation of ocean pH. The blue stars are the data points — the empirical evidence.
James Delingpole on ‘Breitbart’:
NOAAgate: ‘ocean acidification’ could turn out to be the biggest con since Michael Mann’s Hockey Stick
- …
The alleged fraud was uncovered by Mike Wallace, a hydrologist with nearly 30 years’ experience now working towards his PhD at the University of New Mexico. While studying a chart produced by Feely and Sabine, apparently showing a strong correlation between rising atmospheric CO2 levels and falling oceanic pH levels, Wallace noticed that some key information had been omitted.
Mysteriously, the chart only began in 1988. But Wallace knew for a fact that there were oceanic pH measurements dating back to at least 100 years earlier and was puzzled that this solid data had been ignored, in favour of computer modelled projections.
It has all the usual marks of modern bureaucratized science: scientists use a short stretch of data and computers to guesstimate a long “dataset”. Then when asked, they get huffy, hide the data, and insult the questioner. The poor sod seeking access to publicly funded data has to do an FOIA request, which in this case wasn’t successful, but then he got the data another way anyhow. Money was wasted hiding the data, it was wasted on bad policies, it was wasted defending an FOIA request, and dare I suggest, it was wasted training and paying the salaries of people who call themselves scientists but don’t act like them.
Feely’s chart, first mentioned, begins in 1988—which is surprising, as instrumental ocean pH data have been measured for more than 100 years — since the invention of the glass electrode pH (GEPH) meter. As a hydrologist, Wallace was aware of GEPH’s history and found it odd that the Feely/Sabine work omitted it. He went to the source. The NOAA paper with the chart beginning in 1850 lists Dave Bard, with Pew Charitable Trust, as the contact.
Wallace sent Bard an e-mail: “I’m looking in fact for the source references for the red curve in their plot which was labeled ‘Historical & Projected pH & Dissolved Co2.’ This plot is at the top of the second page. It covers the period of my interest.” Bard responded and suggested that Wallace communicate with Feely and Sabine—which he did over a period of several months. Wallace asked again for the “time series data (NOT MODELING) of ocean pH for 20th Century.”
Sabine responded by saying that it was inappropriate for Wallace to question their “motives or quality of our science,” adding that if he continued in this manner, “you will not last long in your career.” He then included a few links to websites that Wallace, after spending hours reviewing them, called “blind alleys.” Sabine concludes the e-mail with: “I hope you will refrain from contacting me again.” But communications did continue for several more exchanges.
In an effort to obtain access to the records Feely/Sabine didn’t want to provide, Wallace filed a Freedom of Information Act (FOIA) request.
We were told that coral reefs would crumble, crabs and molluscs would be unable to build their protective shells, the ocean food chain would collapse, and therefore the global food chain would fall apart.
Clearly the ten year moving average of ocean pH since 1910 has a slight upward curve. This means that in fact the alkalinity of the ocean has increased, not decreased. It has become LESS ACIDIC. The researchers Feely and Sabine would have known this. But it suited their purpose to truncate the data to start in 1988 to allow them to show a falling pH level over that relatively short period instead of the actual long-term increasing trend.
Wallace says: “Oceanic acidification may seem like a minor issue to some but, besides being wrong, it is a crucial leg to the entire narrative of ‘human-influenced climate change’.”
He adds: “In whose professional world is it acceptable to omit the majority of the data and also not disclose the omission to any other soul or Congressional body?”
What we have here is one of the basic foundations of the climate change scare, that is falling ocean pH levels with increased atmospheric CO2 content, being completely dismissed by the empirical ocean pH data the alarmist climate scientists didn’t want to show anyone because it contradicted their ‘increasing ocean acidity’ narrative.
Further information
- Marita Noon runs a blog called Energy Freedom. Her post on this.
- There is a petition set up by Wallace to restore the worlds ocean pH measurements
- The man who uncovered this is Mike Wallace.
- Read here for the full final draft of the most recent UN IPCC Report.
- Read here for the extracts confirming the above points.
h/t to Joffa, Climate Depot, Heartland


1 comment:
more computer simulations. more fraud, more errors and less truth.
Post a Comment